New Paper: Identifying and accounting for the Coriolis effect in satellite NO2 observations and emission estimates
Published:
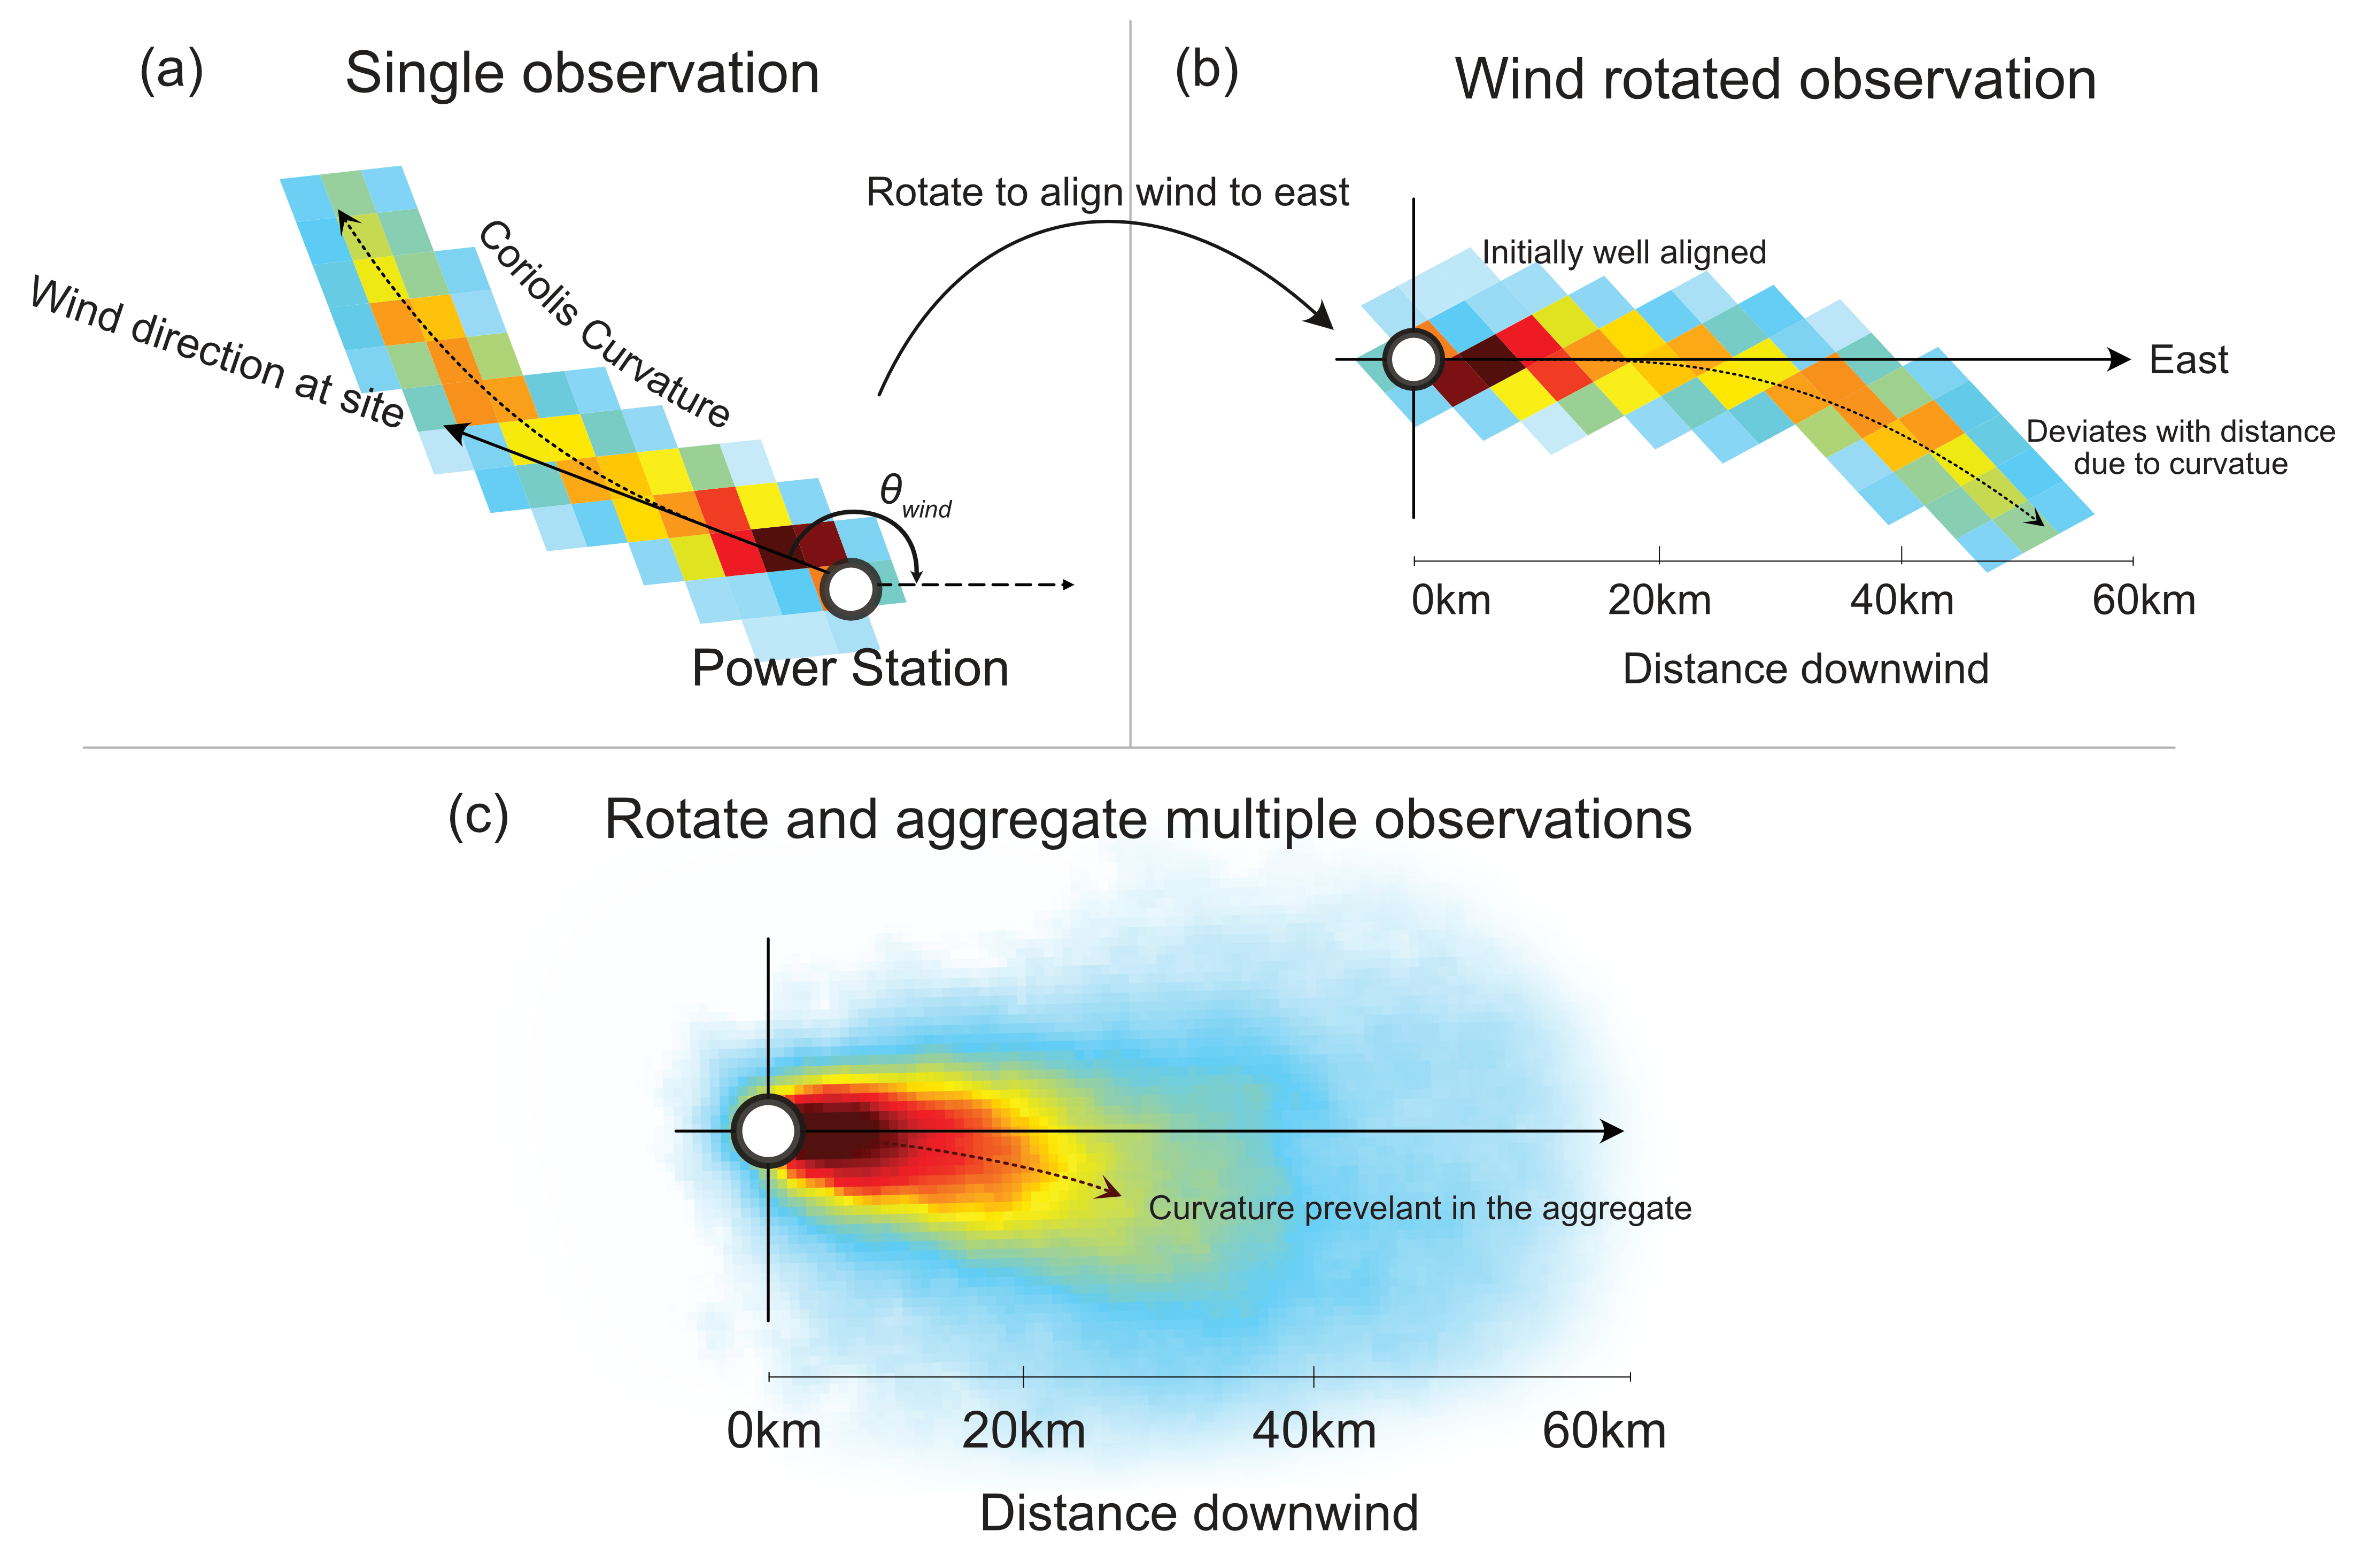
Last year, whilst showing my Environment Agency supervisor some plots of NO2 emission plumes from various power stations around the world, we noticed something. In a wind rotated average, the averaged plume from a German powerstation ever so slightly deviated clockwise from the horizontal axis, and a powerstation we were investigating in South Africa deviated ever so slightly anti-clockwise. That afternoon I ran a few more sites, and after confirming our suspicions I began a 3 month investigation into the Coriolis effect, climate polluters and the impact of curvature on emission estimates. Below is the paper that came from the study, finally published in Atmospheric Chemistry and Physics.

Abstract
Recent developments in atmospheric remote sensing from satellites have made it possible to resolve daily emission plumes from industrial point sources around the globe. Wind rotation aggregation coupled with statistical fitting is commonly used to extract emission estimates from these observations. These methods are used here to investigate how the Coriolis effect influences the trajectory of observed emission plumes as well as to assess the impact of this influence on satellite-derived emission estimates. Of the 16 industrial sites investigated, 9 showed the expected curvature for the hemisphere that they reside in, 5 showed no or negligible curvature, and 2 showed opposing or unusual curvature. The sites that showed conflicting curvature reside in topographically diverse regions, where strong meso-γ-scale (2–20 km) turbulence dominates over larger synoptic circulation patterns. For high-curvature cases, the assumption that the wind-rotated plume aggregate is symmetrically distributed across the downwind axis breaks down, which impairs the quality of statistical fitting procedures. Using annual NOx emissions from Matimba power station as a test case, not compensating for Coriolis curvature resulted in an underestimation of ∼ 9 % on average for the years 2018 to 2021. This study is the first formal observation of the Coriolis effect and its influence on satellite-derived emission estimates, and it highlights both the variability in the emission calculation methods and the need for a standardised scheme for these data to act as evidence for regulators.
